
For those of you who have commented in the past, “I usually skip the stats posts,” you’ll want to close Google Chrome right now.
Then again, if you want to sound informed when you talk real estate at the next box social, or wherever youngsters congregate these days, perhaps have a skim.
On Friday, my rather tame “rant” sought to dispel the myth-de-jour about “investors” being responsible for the increase in real estate prices in our country.
This time around, it wasn’t real estate agents who buy and sell like insiders, or the evil foreign buyer, or those damn flippers and speculators, but rather investors.
Every week, it’s another group of people who feel the wrath of those who can’t afford to buy what they want, or the wrath of politicians who can’t admit that their inability to put forth a true long-term housing strategy is really the cause.
I provided you with a good number of links and headlines in Friday’s blog, but a reader showed me that I missed a very important one:
“First-Time Home Buyers In Toronto Being Pushed Out By Investors”
This is a ridiculous headline.
There’s absolutely no data to support this, other than guesswork and anecdotes.
Not only that, are first-time buyers being “pushed out” or were they already out? How many people who would argue they’re being “pushed out” have a right to be in the market in the first place? A 26-year-old couple can’t buy a detached house in High Park and they’re sore about it. A lot of the readers hit on the same theme I’ve been pushing over the last few years: the combination of entitlement and naivety is a major reason why people claim they “can’t afford” a house in Toronto.
In the CBC article I referenced on Friday, a woman lamented that she and her husband can’t afford what they want in Toronto. But she says they moved from Edmonton. Just consider how tough it is to climb the property ladder here in Toronto while you’re on the Toronto-specific ladder; now consider how tough it is to do so when your starting point is Edmonton?
Despite the federal government enacting a slew of measures aimed at cooling the market in the last decade, all on the demand-side of the equation, the market has continued to run.
During that very same time, I’ve been stressing the importance of supply-side measures to help affordability in the long-term, but for whatever reason (and there are many…) the government has never got this off the ground.
Specifically what the government can do is a topic for another day.
Today, I want to show you just why our problem in Canada, more specifically here in Toronto, is a function of lack of supply.
First, let’s look at “New Listings” in Toronto each and every year since 2002:
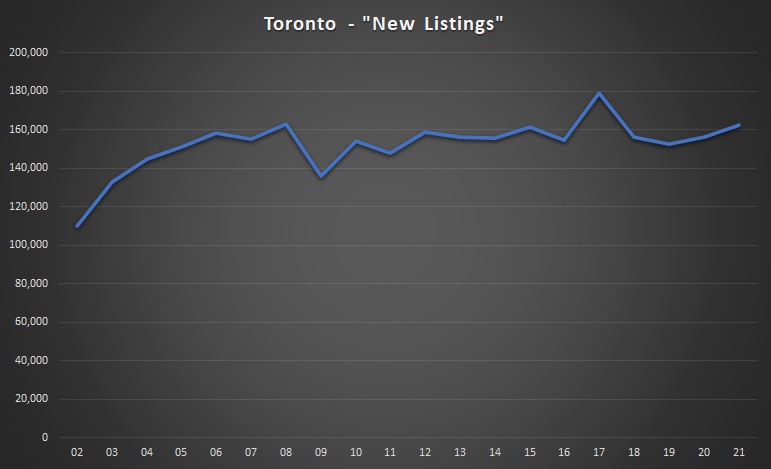
I have estimated 2021, with 151,359 new listings through ten months, I’ve extrapolated that figure to 163,446 for the year (built-in assumption that we see 65% of the new listings from November/December of 2020, since New Listings are down, on average, 35% per month over the last four months).
Note just how little New Listings are up from the pandemic-stricken 2020. That’s shocking! And that, combined with a surge in sales (more on this later) are reasons why we’re seeing a 20% annual increase in the overall market.
But if you look back twenty years, and then fast-forward to today, you have to wonder: Why aren’t MORE properties being listed?
As our city grows, there should be more houses! In twenty years, how much has the housing stock increased?
I can tell you almost exactly: 638,575 new units. New houses and condos, according to the data that I’ll be using for my charts to follow shortly.
But if we’ve got 638,575 more houses and condos in Toronto today than in 2002, then why doesn’t the New Listings chart point up?
Despite seeing an increased number of dwellings in Toronto, we are not seeing an increased number of dwellings up for sale! In fact, that number is declining.
This is the problem in Toronto.
The population is growing.
Immigration is growing.
The need and want for housing is growing, but fewer people are selling.
The CMHC has incredible data available for you, if you’re interested, and it’s free!
Here’s their interactive tool: https://www03.cmhc-schl.gc.ca/hmip-pimh/en#Profile/1/1/Canada
I’ve used their “Toronto Historical Completions By Intended Market” to analyze completions from 1990 through 2020 just to see how the number of completions and the type of completions has changed in three decades.
The results are shocking.
First, let’s look at “Homeowner,” as they define it, but we call that “Freehold”:

As you can imagine, not nearly enough homes are being built to satisfy demand.
In 2020, we saw only 8,479 “Homeowner” completions, down from 10,387 in 2019, and way down from 18,115 in 2018.
That figure is the lowest since this data set began in 1990, and I know that 2020 was ravaged by a worldwide-pandemic, but even if you round this up to match 2019’s figure, it’s still clear that we’re at all-time low levels.
There’s no way to look at this chart and conclude that supply isn’t the problem in our real estate market. Demand is there. It always has been, and always will be. And while some may argue that low interest rates are a major factor, I still don’t think that holds a candle to the lack of supply as a reason.
How about purpose-built rentals?
Who builds those anymore? Not when you can build condos and make more money, right?
Purpose-built rentals were a hot ticket back in the 1990’s, but when the condo boom happened in Toronto, the number of completions dropped off significantly:
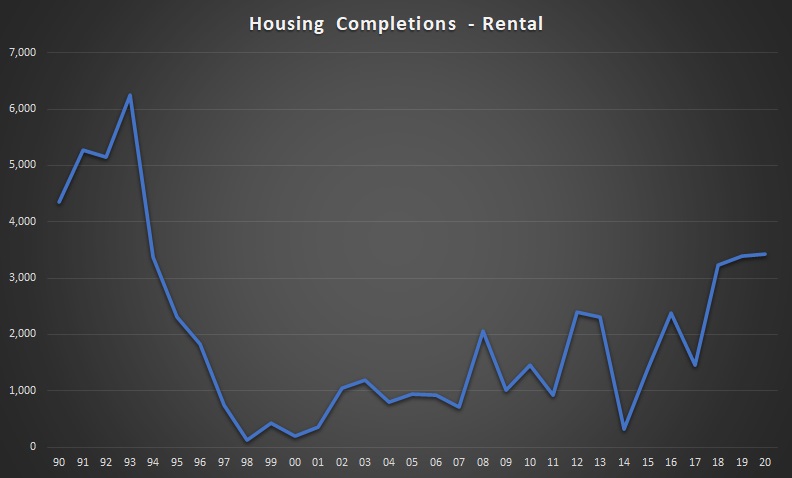
Perhaps the one highlight in this chart is that pupose-built rentals have increased over the last few years. We’ve seen a few notable projects, some arriving with much fanfare, in a city dominated by condominium development.
Now, what of the condo completions?
Have a look:
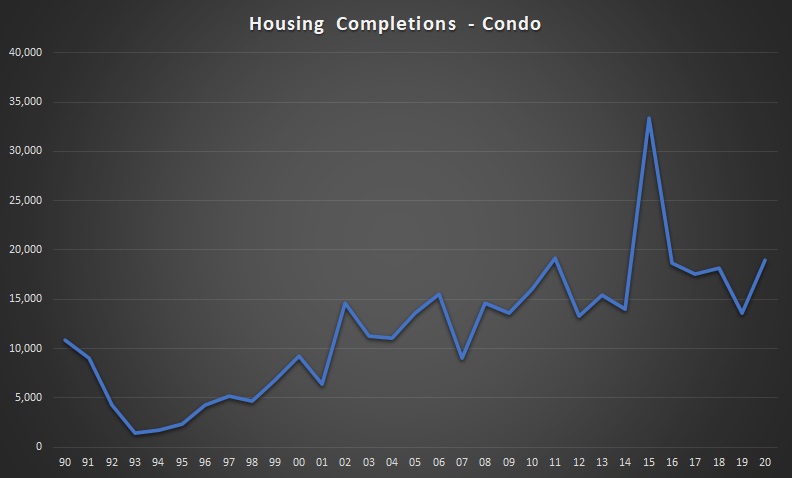
Condo completions have been steadily increasing, which is good, but not nearly at the rate that is required in order to satisfy both “demand” in terms of users/investors, but also necessity, as we’ll see in a moment when we look at immigration.
So how does total housing completions look, when we combined, homeowner, rental, condo, and co-op (the latter of which is a minuscule figure for which I didn’t include a chart)?
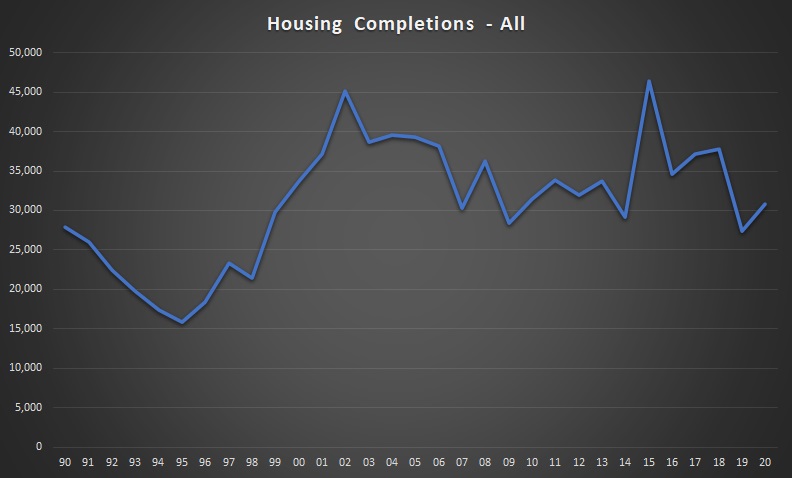
The “peak” in 2014-2015 coincides with the condo chart, but the lack of completions in recent years is disturbing.
Not only that, for a growing city, and one that’s starved for real estate, we’d like to see the blue line on this chart simply point up and to the right on a solid diagonal.
It’s highly concerning that in 2019, we produced the same number of new dwellings as we did in 1999.
The subject of immigration came up in the comments section of Friday’s blog, and I think while the topic can be sensitive, it’s an important one.
Some readers commented that immigration is necessary due to our aging population and shrinking workforce.
Some readers commented that to bring in 400,000 new residents every year, without a corresponding increase in housing completions, is a surefire way to decrease housing affordability.
Can I agree with both points?
Sure, we call can. And therein lies the problem!
Let’s look at Canada’s immigration statistics from the turn of the millennium onwards:
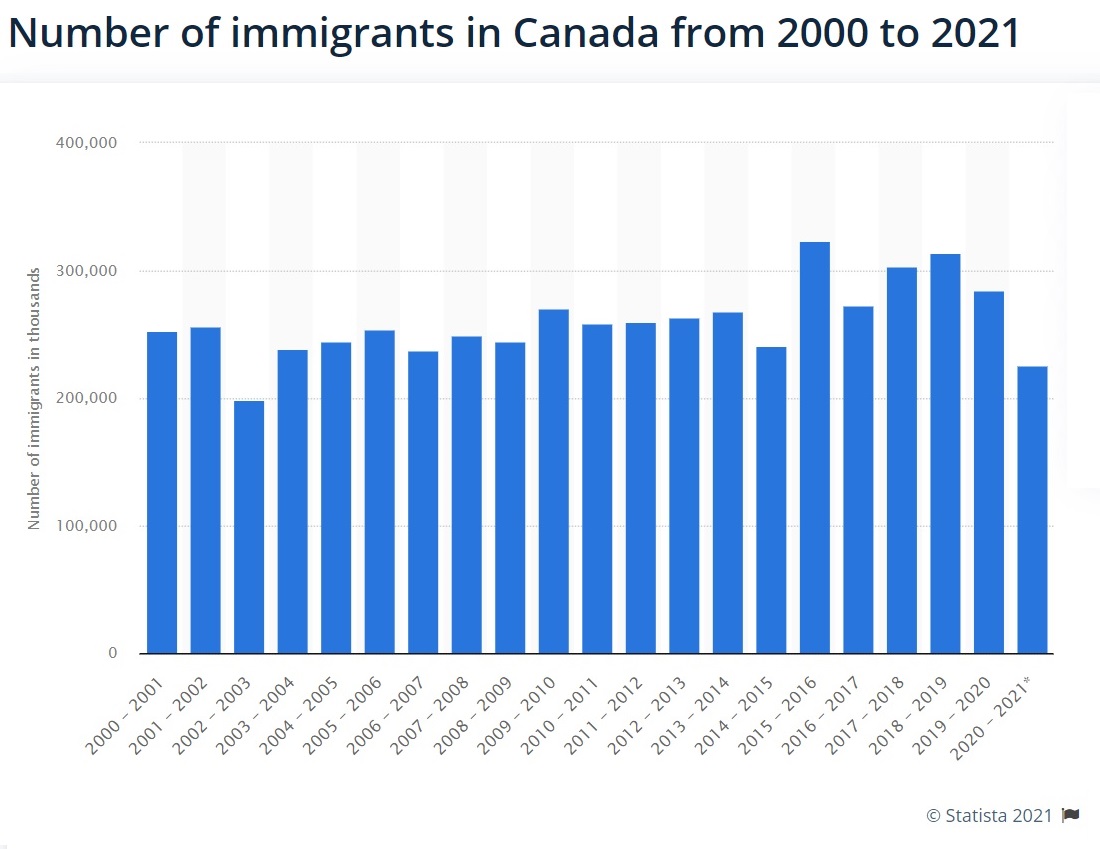
Obviously, the pandemic caused immigration to decline, if not pause for a short while, but overall, we can see a trend toward 300,000+ immigrants every year. In fact, there’s been talk of 400,000 immigrants in 2022.
For a country with a population of around 38 Million people, this is “only” a 1.05% increase every year. On a relative basis, that’s low. On an absolute basis, it’s still 400,000 people.
Of these 400,000 people, how many would end up in Toronto?
Here’s a great chart showing where the 284,387 immigrants in 2020 ended up residing:
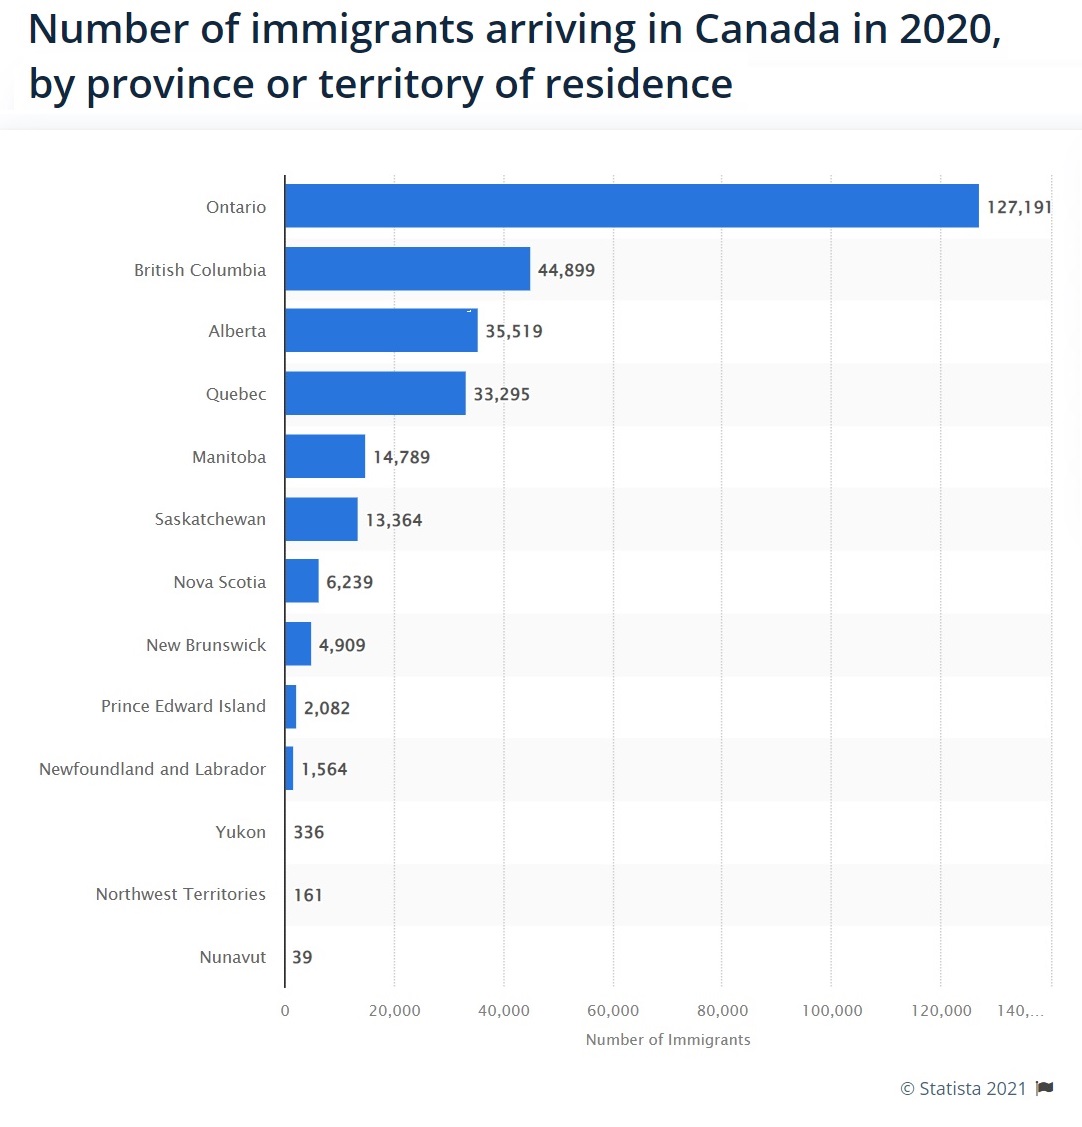
Almost 45% of those immigrants ended up in Ontario.
And while I’m sure some ended up in North Bay or Sudbury, most ended up in the Golden Horseshoe, specifically the GTA.
So if we have 400,000 immigrants entering Canada every year, and 45% of them in Ontario, then that’s 180,000.
Let’s say that 150,000 of those 180,000 end up in the GTA.
Let’s also say that the average household is 3.0 individuals since we might have a lone immigrant and we might have a family of six. That means we need 60,000 new dwellings to accommodate these 180,000 new Torontonians.
As you can see from the chart above, “Housing Completions – All,” we have never completed 60,000 dwellings in a year in Toronto. According to that CMHC data, the most is 46,384 in 2015.
Even if we play around with these numbers, and assume 300,000 immigrants instead of 400,000, we’re still coming up way, way shy.
Immigration is not the problem in our market. Surely that’s not the conclusion that we’re coming to after looking at this data, so let me make that clear.
Every country needs immigration, especially Canada, with an aging population and a litany of jobs that Canadians don’t want to do. But with the bulk of immigrants arriving in Toronto, we’re going to see a massive deficit in housing each and every year. This comes as no surprise to you, me, and anybody reading this blog. So does it come as a surprise to a federal government who sets immigration and housing policy? Or have they just decided, internally, that there’s nothing they can do about it?
Simply put: we have too much demand, and not enough inventory.
The government has tried, basically since 2008, to bring “stability” to the market by attempting to decrease demand.
None of that has worked.
So the only rational conclusion now is that they must focus on supply, is it not?
At the onset, I showed you a chart with “New Listings” in Toronto dating back to 2002.
Let’s look at this chart again but also plot Sales just to see how the gap is narrowing:
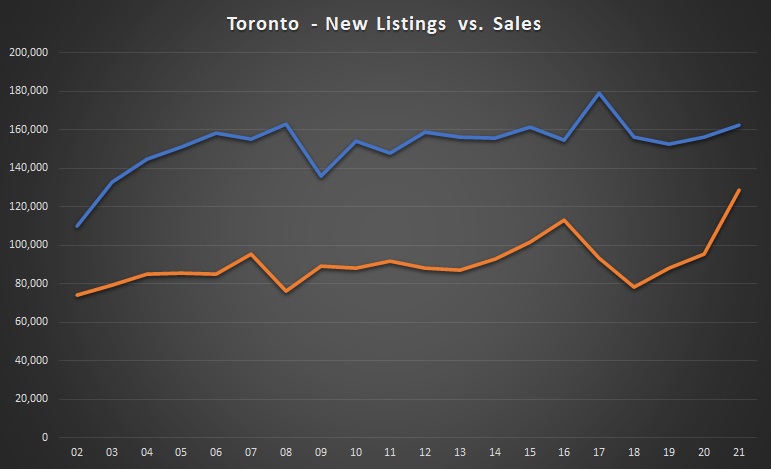
Again, I’ve extrapolated 2021 sales to include an increase in November/December sales based on the increase in the first ten months thus far.
But look at how small that gap is! The lines have never been closer.
Not only are we going to see an all-time record for sales in 2021 – in a city starved for inventory, but we’re also seeing the “tighest” market ever in terms of the sales-to-new-listings ratio.
This chart should scare the pants off all of us:
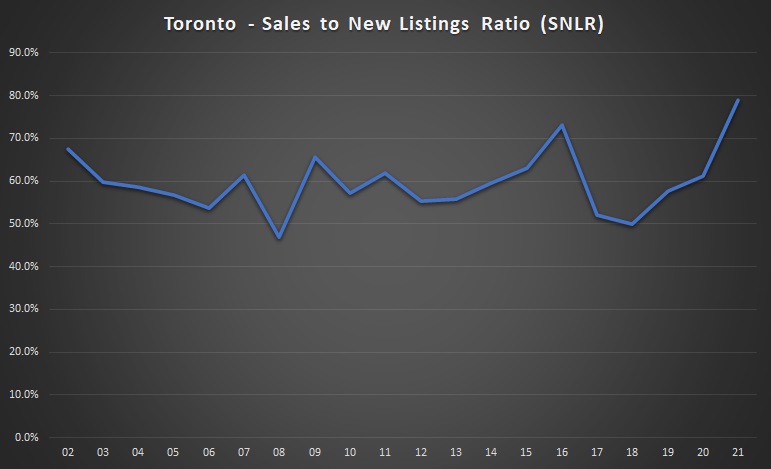
The SNLR for 2021 is going to approach 80%.
That’s a factor of high demand and low supply.
New Listings in 2021 are at the same level they were in 2006. The expectation that a “growing, larger city, with more houses, will produce more listings” is flawed.
But sales aren’t just pacing 2006; they’re up by 50%.
Increasing demand with stagnant supply is a recipe for price increases, all day, every day.
So let’s watch the media, the government, and the real estate bears, and the envious all continue to blame foreign buyers, investors, flippers, speculators, real estate agents, and rich parents for the housing “problem” in this country. The rest of us can sleep well knowing we’ve actually done our homework…